
Practical AI · 7 min read
Use ChatGPT, Claude or Copilot inside Excel
By Hank BarkerPublished
Open a copy of a workbook, ask the AI to explain its structure, then give it one specific change. Once you can check that change, move on to a summary, PivotTable or chart. This guide covers the three setup routes and gives you a small workbook with answers you can verify yourself.
Open a copy of a workbook, ask the AI to explain its structure, then give it one specific change. Once you can check that change, move on to a summary, PivotTable or chart. This guide covers the three setup routes and gives you a small workbook with answers you can verify yourself.
Demonstration status: the workbook and Claude add-in were opened in Excel and captured below. The add-in stopped at sign-in. The analysis, PivotTable and chart prompts in this draft are practice instructions awaiting a signed-in walkthrough, not screenshots of completed AI operations.
Choose the route available in your account
ChatGPT: Open Excel's Home tab, choose Add-ins and find the official ChatGPT add-in. Open it and sign in. OpenAI also documents using the add-in with Codex in the desktop app. Check the official setup page for current account and organization requirements.
Claude: Activate the official Claude add-in in Excel and sign in with a supported Claude account. The current Claude for Excel documentation lists compatible Excel versions and plans. It supports workbook questions with cell references, assumption changes and spreadsheet operations. Organization settings can affect installation.
Copilot: Look for Copilot in Excel and check whether your account offers the editing mode you need. Microsoft distinguishes available modes and platform support in its setup instructions. A missing button may be an account or organization setting, not something wrong with your workbook.
You do not need all three for this exercise. Pick one you can access and learn how it behaves on a small, understandable file. These are routes inside Excel; uploading a workbook to an ordinary chat is a separate workflow and may return a downloadable copy rather than change your open file.
1. Open the practice workbook
Download Maple-Attendance.xlsx. Save a working copy before experimenting. The fictional example has three classes, attendee counts, a price and calculated revenue. It is deliberately small enough to check manually.
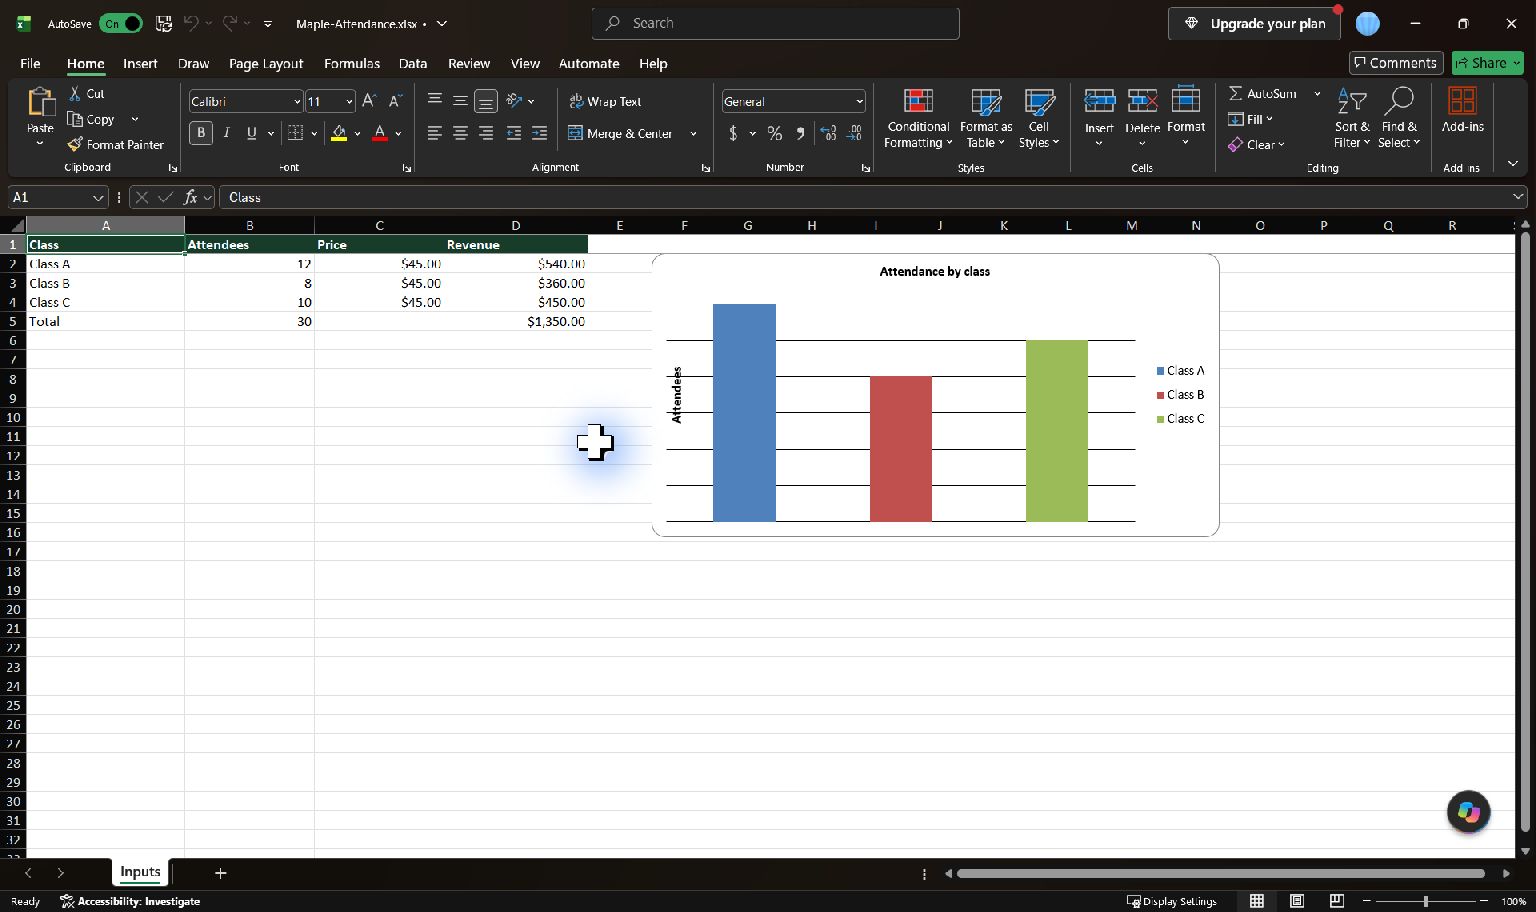
The workbook is the starting input. It was prepared for the exercise; this screenshot does not claim an AI add-in created it.
The expected starting calculation is 12 × $45 = $540, 8 × $45 = $360, and 10 × $45 = $450. Together, that is 30 attendees and $1,350 revenue. Revenue is money from sales before costs; this workbook does not establish profit.
For your own data, use clear column names and consistent values. Put one record on each row and avoid mixing unrelated tables into the same range. Explain any abbreviations or business definitions the AI would not know.
2. Open the add-in and confirm access
In the demonstrated Windows installation, the route was Home, Add-ins, then the installed Claude add-in. The side panel opened and requested sign-in.
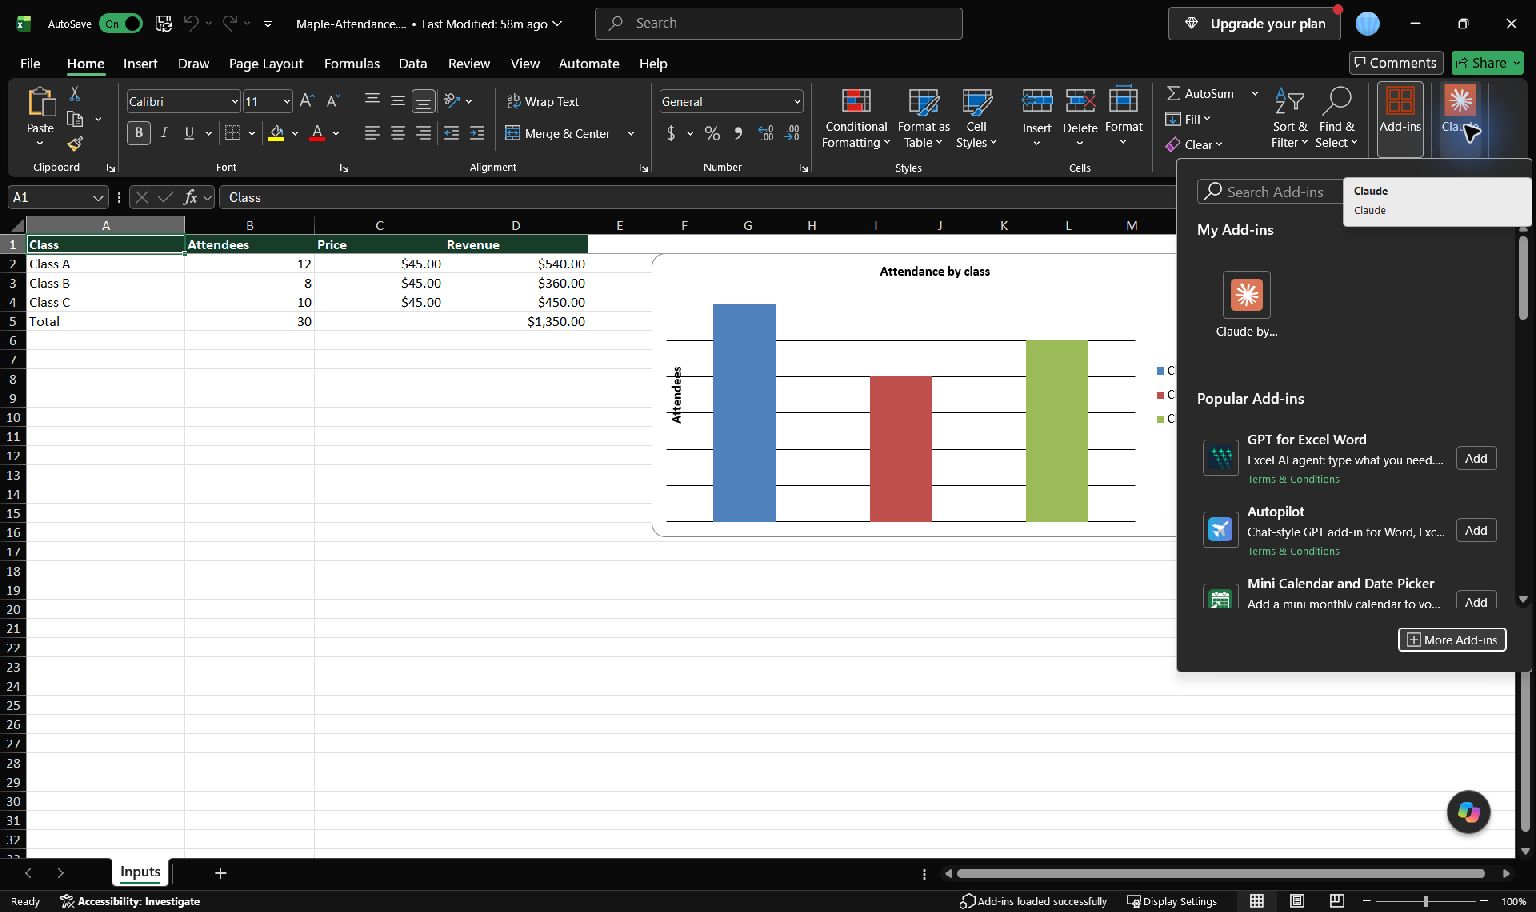
Choose the official add-in that belongs to the service you intend to use.
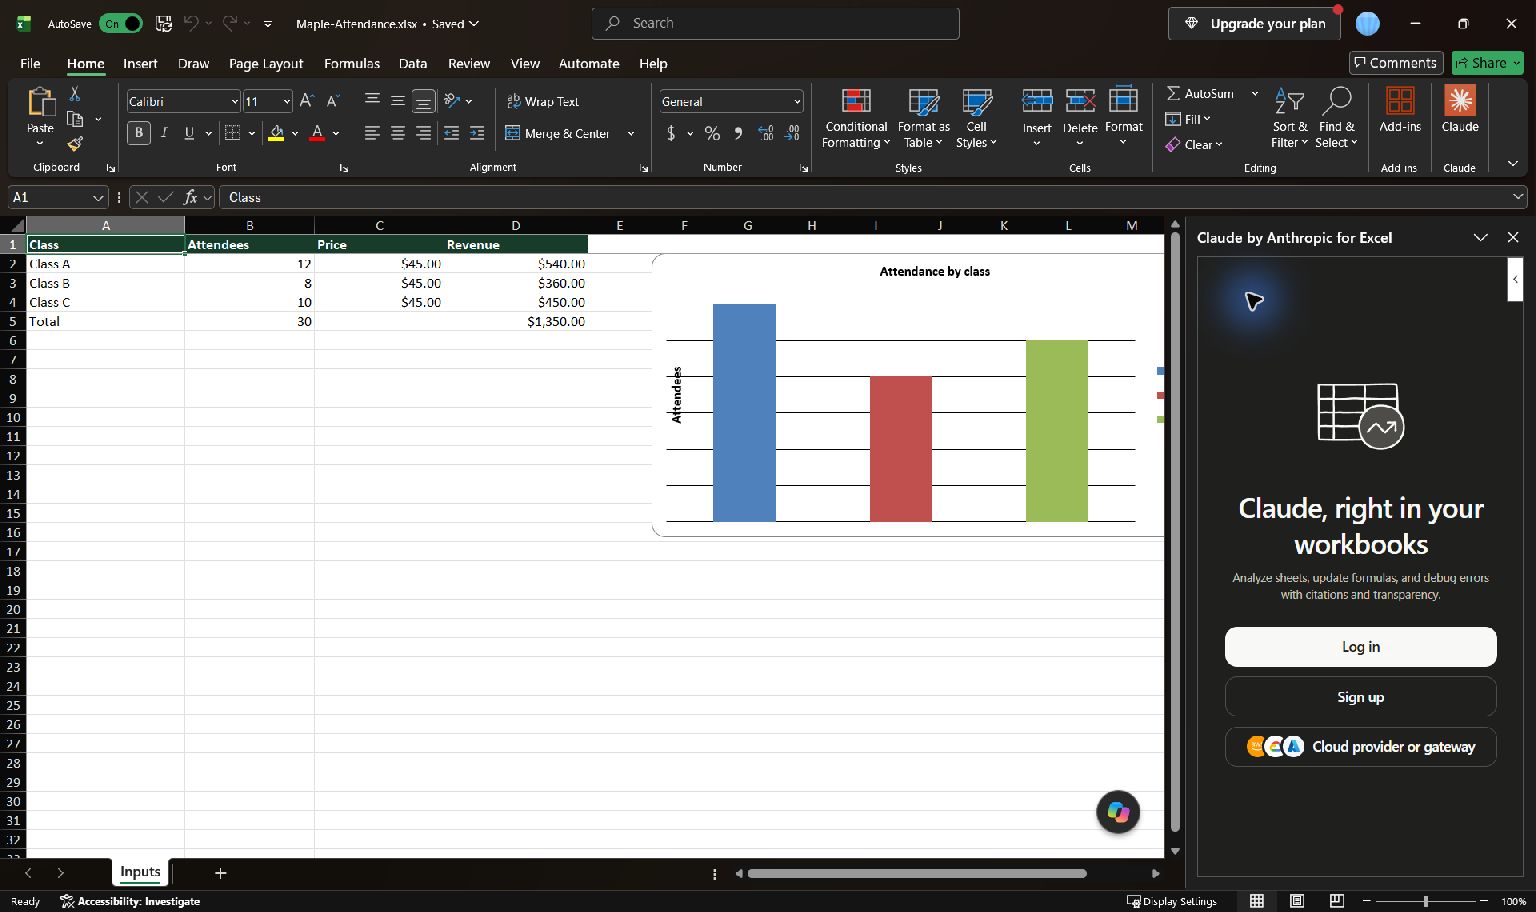
This is where the live demonstration stopped. No workbook analysis was completed through this signed-out panel.
Once signed in, start with a read-only question. Do not jump directly to “improve this spreadsheet.”
Explain the sheets, column headers and formulas in this workbook. Identify the input cells and calculated cells. Tell me how total revenue is calculated and cite the relevant cells. Do not change anything yet.
Check that it refers to the open workbook and identifies formulas rather than treating every displayed number as a hard-coded input. Click cell references when the add-in provides them.
3. Make one change you can predict
In my working copy, change only Class C's price from $45 to $50. Preserve the attendee counts and revenue formulas. Tell me which cell changed and what the new total should be.
The expected result is Class C revenue of $500 and total revenue of $1,400. The increase is $50 because ten attendees each pay $5 more. If the result differs, check whether the wrong row changed or a formula was replaced.
Use this pattern on real work: name the exact input, specify what stays unchanged, and ask for the affected calculations. Avoid changing several assumptions at once while you are still learning how the tool edits your file.
4. Ask for a useful summary
Create a separate Summary sheet showing attendees and revenue by class. Keep the source sheet unchanged. Show total attendees and total revenue, and state which source range you used. Use formulas or links where appropriate so the summary can be checked.
Compare the summary against the original rows. A neatly formatted table is not enough; it should include the intended data and use the correct units. If you later add a class, check whether the summary includes it.
For a larger list, ask for a PivotTable when your chosen add-in supports it:
Create a PivotTable on a new sheet with Class as rows and the sum of Attendees and Revenue as values. Exclude any existing grand-total row from the source so it is not counted twice. Explain how to refresh it after the source changes.
This exercise's three rows make a PivotTable unnecessary for the calculation, but easy to verify as a learning step. Microsoft explains PivotTables, PivotCharts and refresh behavior. If your tool creates a static summary instead, it should say so; a formatted table is not automatically a PivotTable.
5. Turn the numbers into a chart
Add a column chart comparing revenue by class. Use a clear title, dollar labels and a zero baseline. Do not include the grand total as another class. Keep it on the Summary sheet without covering the table.
Check the bars against the cells. After the Class C change, the values should be $540, $360 and $500. Check the title, axis and source range. Ask for a chart that helps answer your question; a 3D effect does not make the analysis better.
For other datasets, tell the AI what the reader needs to compare. Monthly changes, category comparisons and proportions are different questions and may need different charts.
6. Save and reopen the result
Save the working copy with a new name. Reopen it and check that the formulas, chart and summary are still present. Change a small input and see whether the expected dependent values update. If you created a PivotTable, test its refresh rather than assuming it updates instantly.
Ask for a final change report: sheets added, cells changed, formulas affected and anything the tool could not complete. Keep that report with the workbook while reviewing the result.
Troubleshooting
If the add-in cannot read the workbook, confirm it is open and that the panel is signed in. If an operation is unavailable, ask what the tool can do in the current mode instead of treating its text answer as proof of an edit. If a number looks wrong, ask it to trace the calculation through specific cells and compare the result manually.
The completed signed-in walkthrough and screenshots of the changed cells, PivotTable and chart are still required before this draft should be presented as a tested end-to-end tutorial.
Keep a copy of the guide
Download the PDF to keep the steps and prompts handy while you work.
Put this to work with your team
I’m Hank Barker, founder of PriorAIty. I help Michigan teams build useful AI habits through hands-on training and adoption consulting, with in-person and virtual options.
Keep going
- Make your AI designs and writing match your brand
Give an AI your real logo, a few designs you like and examples of your writing. Have it identify the choices already present, ask about the choices that are missing, and turn your answers into a brand sheet plus instructions you can reuse. The example here is a fictional workshop business. The screenshots show the actual source review, interview and resulting files.
- Get started with ChatGPT Work
Give Work a concrete assignment, inspect the file it produces, and refine it in the same conversation. This walkthrough starts with a small set of fictional workshop facts and ends with an editable Word checklist. It also shows a real first-draft mistake and the correction that fixed it.
- Claude Code for complete beginners
Start with a folder of notes and finish with a useful document you can open. You will choose the folder, ask Claude to inspect it, review a plan, correct a mistake, and create two files. No terminal commands are required for this desktop walkthrough.
Weekly AI guide
The Weekly AI Guide
One genuinely useful AI use case a week, whatever news matters, and what I've got coming up: free sessions, new guides, upcoming trainings.